Breast Cancer Detection
Project is in Progress
Preliminary Code
Graphical Outputs provided
Clean up Code and Further Model Building and Prediction
https://archive.ics.uci.edu/dataset/17/breast+cancer+wisconsin+diagnostic
import pandas as pd
import seaborn as sns
import matplotlib.pyplot as plt
from sklearn.model_selection import train_test_split
from sklearn.preprocessing import StandardScaler
from sklearn.linear_model import LogisticRegression
from sklearn.ensemble import RandomForestClassifier
from sklearn.svm import SVC
from sklearn.metrics import accuracy_score, precision_score, recall_score, f1_score, roc_auc_score
# Step 1: Read the data from .data file
data_file = '/Users/mohan/Desktop/Breast Cancer Detection/wdbc.data'
column_headers = ['ID', 'Diagnosis'] + [f'Feature_{i}' for i in range(1, 31)]
df = pd.read_csv(data_file, names=column_headers)
# Step 2: Data Exploration and Visualization
print(df.head())
print(df.describe())
print(df.info())
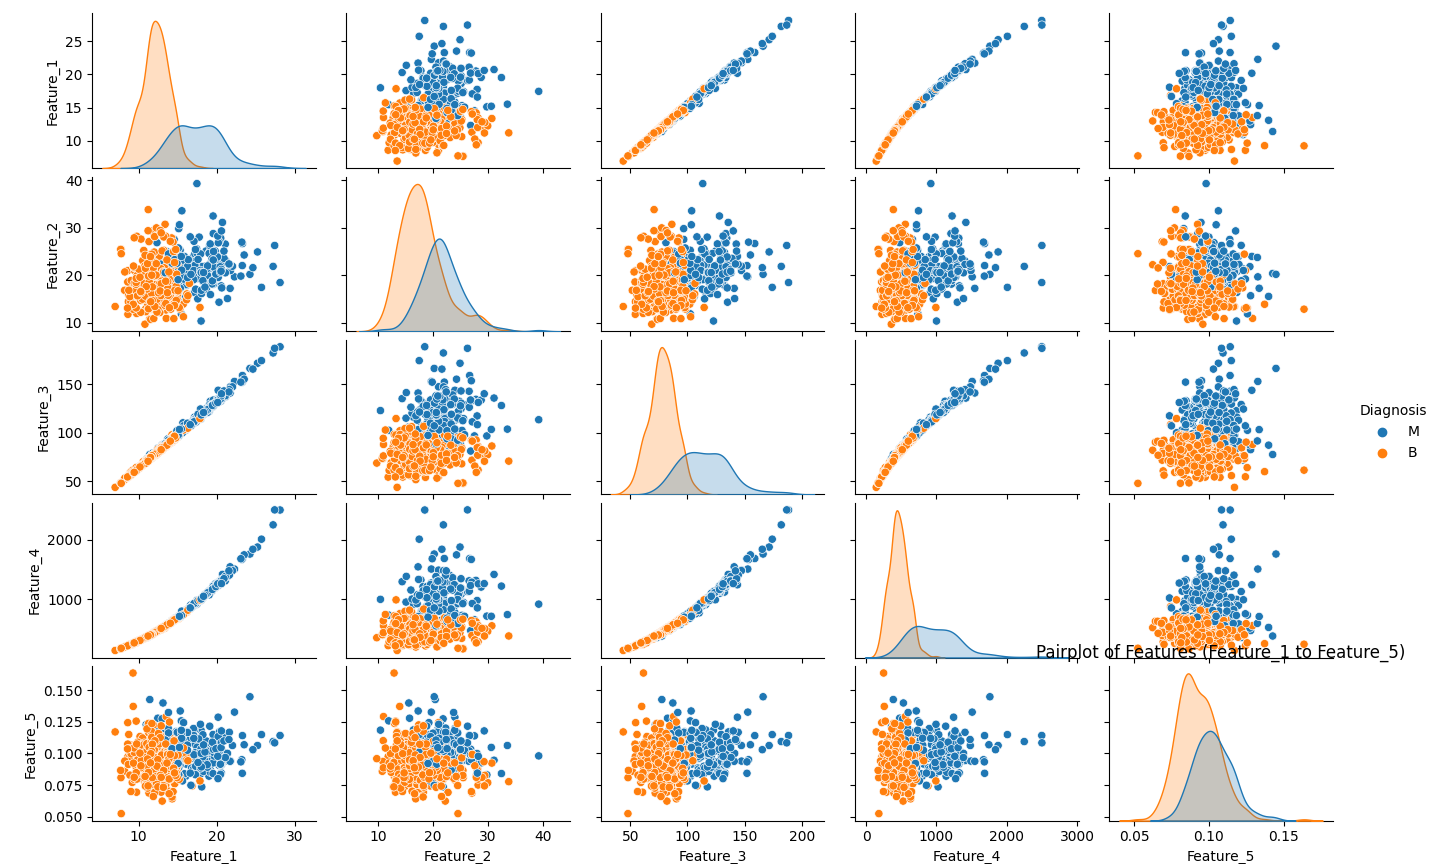
# Pairplot - to visualize pairwise relationships in the dataset
sns.pairplot(df, hue='Diagnosis', vars=[f'Feature_{i}' for i in range(1, 6)])
plt.title("Pairplot of Features (Feature_1 to Feature_5)")
plt.show()
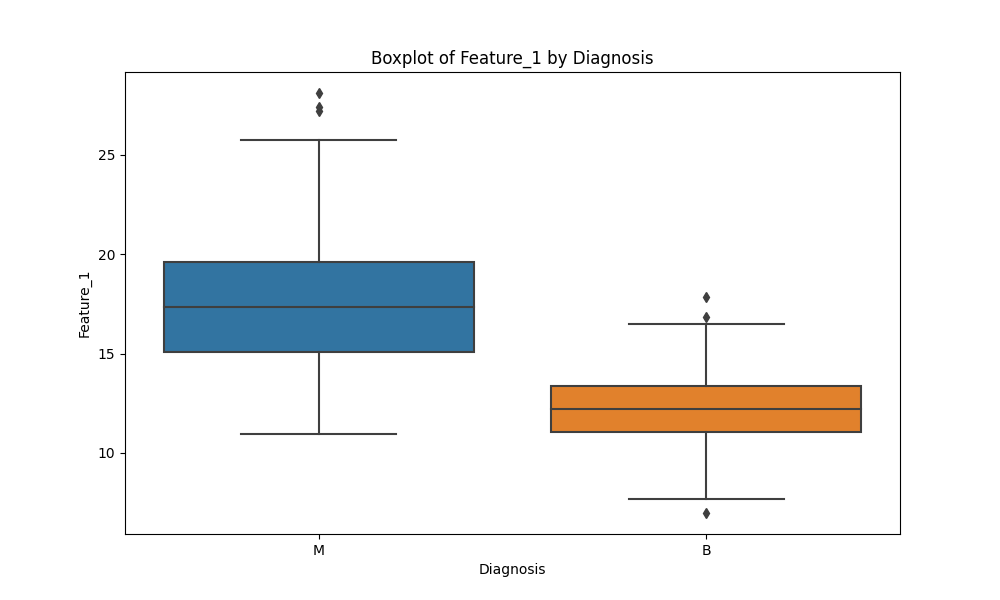
# Boxplot - to visualize the distribution of features by Diagnosis
plt.figure(figsize=(10, 6))
sns.boxplot(x='Diagnosis', y='Feature_1', data=df)
plt.title("Boxplot of Feature_1 by Diagnosis")
plt.show()
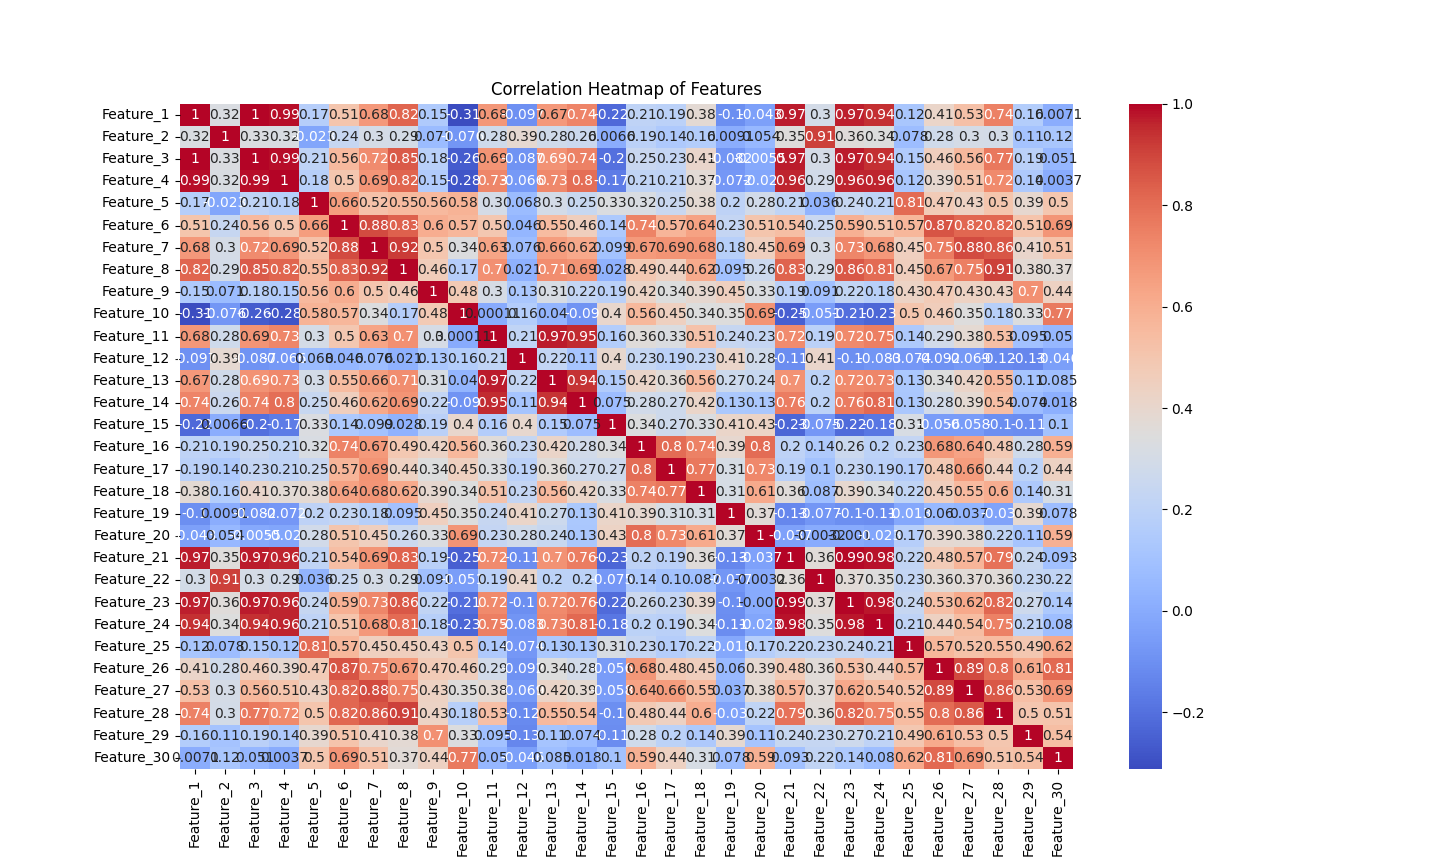
# Heatmap - to visualize the correlation between features
correlation_matrix = df.drop(['ID', 'Diagnosis'], axis=1).corr()
plt.figure(figsize=(12, 10))
sns.heatmap(correlation_matrix, annot=True, cmap='coolwarm')
plt.title("Correlation Heatmap of Features")
plt.show()
# Step 3: Feature Selection
# If you have specific feature selection techniques in mind, apply them here.
# Step 4: Preprocessing
X = df.drop(['ID', 'Diagnosis'], axis=1)
y = df['Diagnosis'].map({'M': 1, 'B': 0})
# Step 5: Train-Test Split
X_train, X_test, y_train, y_test = train_test_split(X, y, test_size=0.2, random_state=42)
# Step 6: Model Selection and Training
# Logistic Regression
lr_model = LogisticRegression()
lr_model.fit(X_train, y_train)
# Random Forest
rf_model = RandomForestClassifier()
rf_model.fit(X_train, y_train)
# Support Vector Machine (SVM)
svm_model = SVC(probability=True)
svm_model.fit(X_train, y_train)
# Step 7: Model Evaluation
def evaluate_model(model, X_test, y_test):
y_pred = model.predict(X_test)
y_prob = model.predict_proba(X_test)[:, 1]
accuracy = accuracy_score(y_test, y_pred)
precision = precision_score(y_test, y_pred)
recall = recall_score(y_test, y_pred)
f1 = f1_score(y_test, y_pred)
roc_auc = roc_auc_score(y_test, y_prob)
print(f"Accuracy: {accuracy:.2f}")
print(f"Precision: {precision:.2f}")
print(f"Recall: {recall:.2f}")
print(f"F1 Score: {f1:.2f}")
print(f"ROC-AUC: {roc_auc:.2f}\n")
print("Logistic Regression Metrics:")
evaluate_model(lr_model, X_test, y_test)
print("Random Forest Metrics:")
evaluate_model(rf_model, X_test, y_test)
print("SVM Metrics:")
evaluate_model(svm_model, X_test, y_test)
# Step 8: Hyperparameter Tuning (optional)
# Step 9: Model Comparison (already done in evaluation)
# Step 10: Model Interpretation (e.g., coefficients for Logistic Regression)
# Step 11: Model Deployment (not included here as it depends on the deployment environment)
ID Diagnosis Feature_1 Feature_2 ... Feature_27 Feature_28 Feature_29 Feature_30 0 842302 M 17.99 10.38 ... 0.7119 0.2654 0.4601 0.11890 1 842517 M 20.57 17.77 ... 0.2416 0.1860 0.2750 0.08902 2 84300903 M 19.69 21.25 ... 0.4504 0.2430 0.3613 0.08758 3 84348301 M 11.42 20.38 ... 0.6869 0.2575 0.6638 0.17300 4 84358402 M 20.29 14.34 ... 0.4000 0.1625 0.2364 0.07678
[5 rows x 32 columns] ID Feature_1 Feature_2 ... Feature_28 Feature_29 Feature_30 count 5.690000e+02 569.000000 569.000000 ... 569.000000 569.000000 569.000000 mean 3.037183e+07 14.127292 19.289649 ... 0.114606 0.290076 0.083946 std 1.250206e+08 3.524049 4.301036 ... 0.065732 0.061867 0.018061 min 8.670000e+03 6.981000 9.710000 ... 0.000000 0.156500 0.055040 25% 8.692180e+05 11.700000 16.170000 ... 0.064930 0.250400 0.071460 50% 9.060240e+05 13.370000 18.840000 ... 0.099930 0.282200 0.080040 75% 8.813129e+06 15.780000 21.800000 ... 0.161400 0.317900 0.092080 max 9.113205e+08 28.110000 39.280000 ... 0.291000 0.663800 0.207500
[8 rows x 31 columns] <class 'pandas.core.frame.DataFrame'> RangeIndex: 569 entries, 0 to 568 Data columns (total 32 columns):
Column Non-Null Count Dtype
0 ID 569 non-null int64
1 Diagnosis 569 non-null object 2 Feature_1 569 non-null float64 3 Feature_2 569 non-null float64 4 Feature_3 569 non-null float64 5 Feature_4 569 non-null float64 6 Feature_5 569 non-null float64 7 Feature_6 569 non-null float64 8 Feature_7 569 non-null float64 9 Feature_8 569 non-null float64 10 Feature_9 569 non-null float64 11 Feature_10 569 non-null float64 12 Feature_11 569 non-null float64 13 Feature_12 569 non-null float64 14 Feature_13 569 non-null float64 15 Feature_14 569 non-null float64 16 Feature_15 569 non-null float64 17 Feature_16 569 non-null float64 18 Feature_17 569 non-null float64 19 Feature_18 569 non-null float64 20 Feature_19 569 non-null float64 21 Feature_20 569 non-null float64 22 Feature_21 569 non-null float64 23 Feature_22 569 non-null float64 24 Feature_23 569 non-null float64 25 Feature_24 569 non-null float64 26 Feature_25 569 non-null float64 27 Feature_26 569 non-null float64 28 Feature_27 569 non-null float64 29 Feature_28 569 non-null float64 30 Feature_29 569 non-null float64 31 Feature_30 569 non-null float64 dtypes: float64(30), int64(1), object(1) memory usage: 142.4+ KB None /Users/mohan/Desktop/Breast Cancer Detection/myenv/lib/python3.9/site-packages/sklearn/linear_model/_logistic.py:460: ConvergenceWarning: lbfgs failed to converge (status=1): STOP: TOTAL NO. of ITERATIONS REACHED LIMIT.
Increase the number of iterations (max_iter) or scale the data as shown in: https://scikit-learn.org/stable/modules/preprocessing.html Please also refer to the documentation for alternative solver options: https://scikit-learn.org/stable/modules/linear_model.html#logistic-regression n_iter_i = _check_optimize_result( Logistic Regression Metrics: Accuracy: 0.96 Precision: 0.97 Recall: 0.91 F1 Score: 0.94 ROC-AUC: 1.00
Random Forest Metrics: Accuracy: 0.96 Precision: 0.95 Recall: 0.93 F1 Score: 0.94 ROC-AUC: 0.99
SVM Metrics: Accuracy: 0.95 Precision: 1.00 Recall: 0.86 F1 Score: 0.92 ROC-AUC: 0.99